Results
The Results page on the FundBox platform provides a detailed view of an investor’s portfolio performance, capital summary, and insightful commentaries. This documentation outlines each section of the Results page.
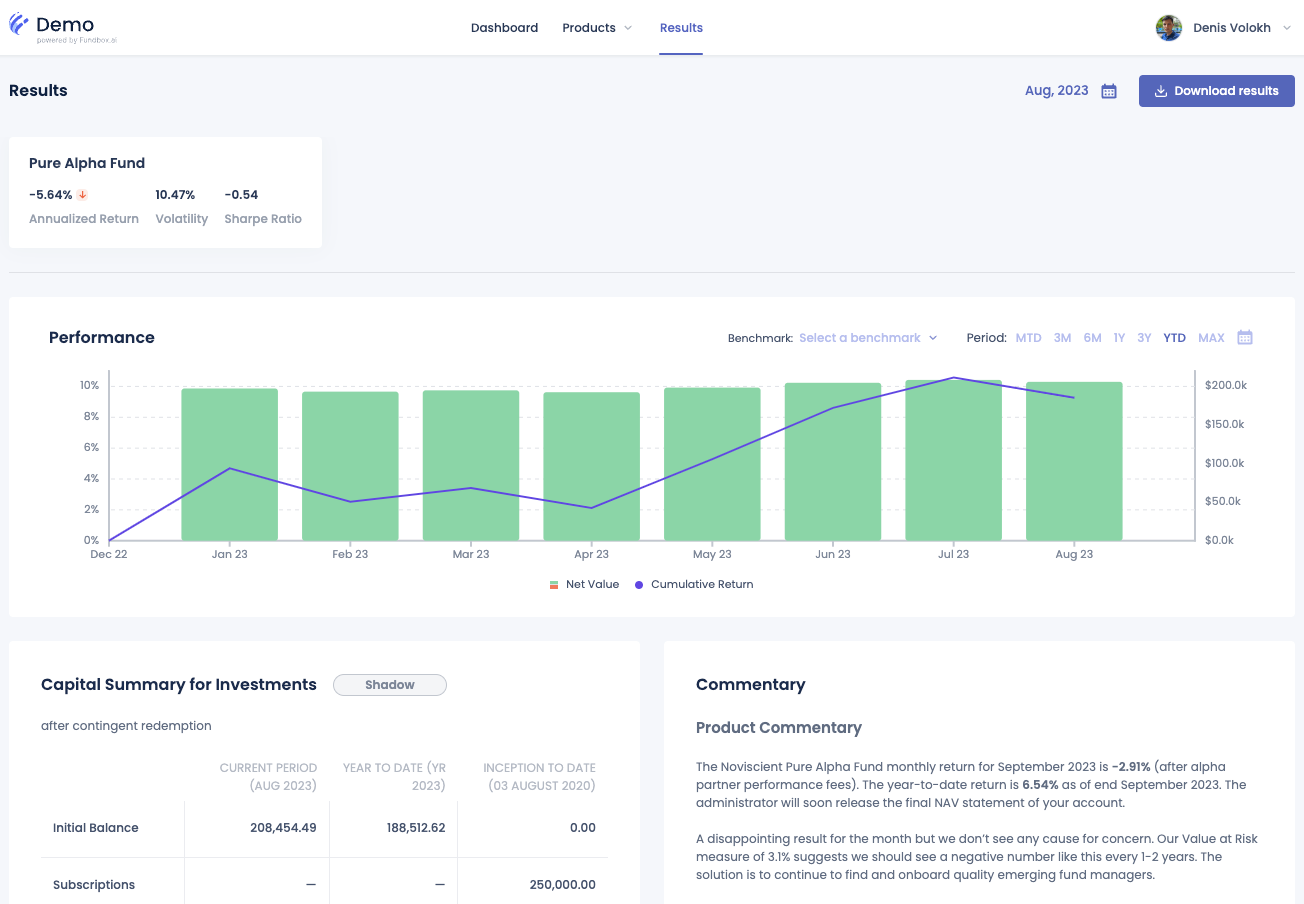
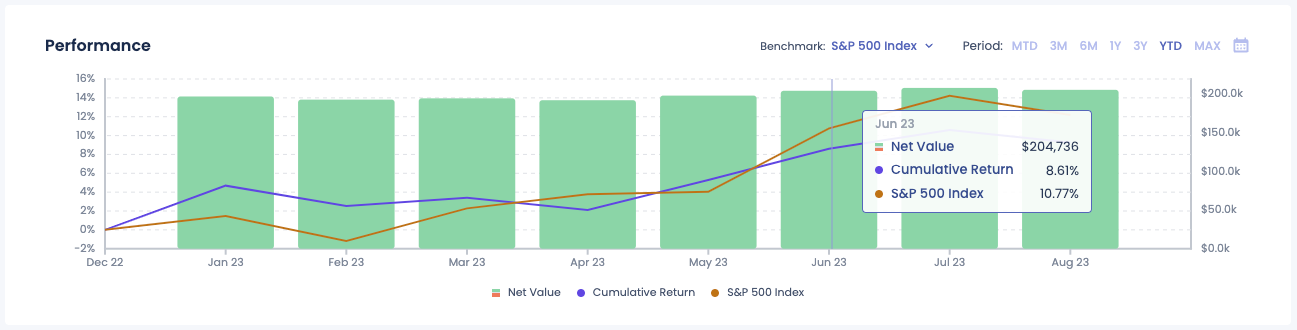
Performance chart
The Performance Chart section allows investors to analyze their portfolio performance over various time frames. Key functionalities include:
- A visual graph showing Net Value and Cumulative Return.
- Options to select time frames such as MTD, 3M, 6M, 1Y, 3Y, YTD, and MAX.
- A benchmark selection feature for performance comparison.
- Interactive elements to hover over data points for detailed metrics.
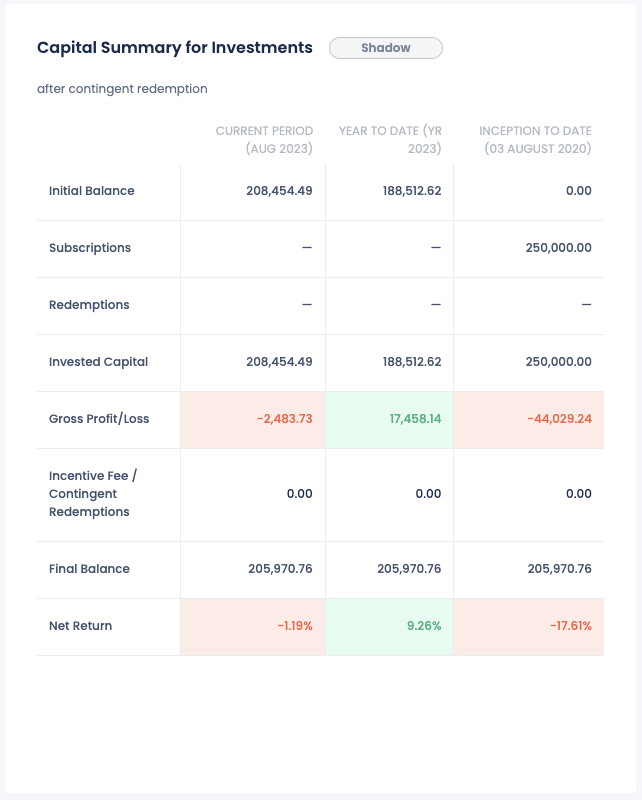
Capital Summary for Investments
The Capital Summary section provides a detailed breakdown of the investment's financial performance over different periods. It includes:
- The value of the portfolio in the current period.
- Year-to-date performance, showing gains or losses since the beginning of the year.
- Inception to date metrics, providing an overview since the start of the investments.
- Detailed metrics such as Initial Balance, Subscriptions, and Redemptions.
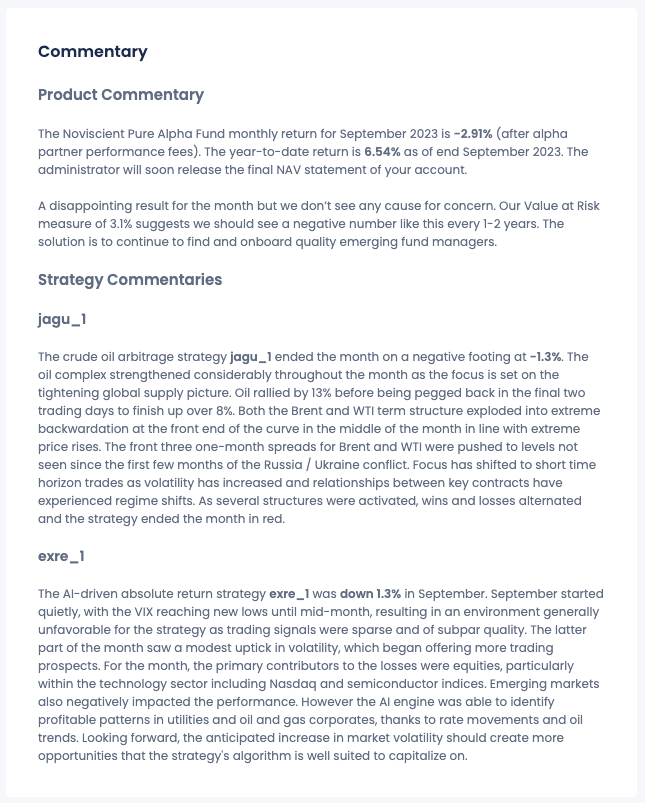
Commentary
The Product Commentary section offers a list of detailed insights and updates from Alpha Partners.