Strategies
The Strategies section of the Manager's Portal provides comprehensive access to all strategies that have successfully passed our rigorous onboarding and qualification process. This section is designed to offer detailed and actionable insights into each strategy's performance and characteristics, enabling managers to effectively compare different strategies.

Key Features:
-
Search Strategies: Easily search for strategies using various criteria such as asset class, market coverage, performance metrics, and more. This feature allows managers to quickly find strategies that meet specific requirements.
-
Performance Preview: Get a quick overview of each strategy's performance, including key metrics like returns, volatility, and drawdown. This snapshot helps in preliminary comparisons and assessments.
-
Full Strategy Profile: Access detailed profiles for each strategy, providing in-depth information on performance, AUM, asset class, market coverage, and historical performance. These profiles offer a comprehensive view of each strategy's characteristics and past performance.
-
Side-by-Side Comparison: Compare multiple strategies side-by-side, allowing for a direct comparison of performance metrics, asset classes, AUM, and other key factors. This feature facilitates a thorough analysis of different strategies in one view.
-
Download Factsheet: Conveniently download factsheets for each strategy, containing summarized information and key metrics. These factsheets can be used for offline analysis and reporting.
By offering these detailed insights and tools, the Strategies page empowers managers to comprehensively analyze and compare different strategies, facilitating a deeper understanding of each strategy's strengths and suitability for various investment objectives.
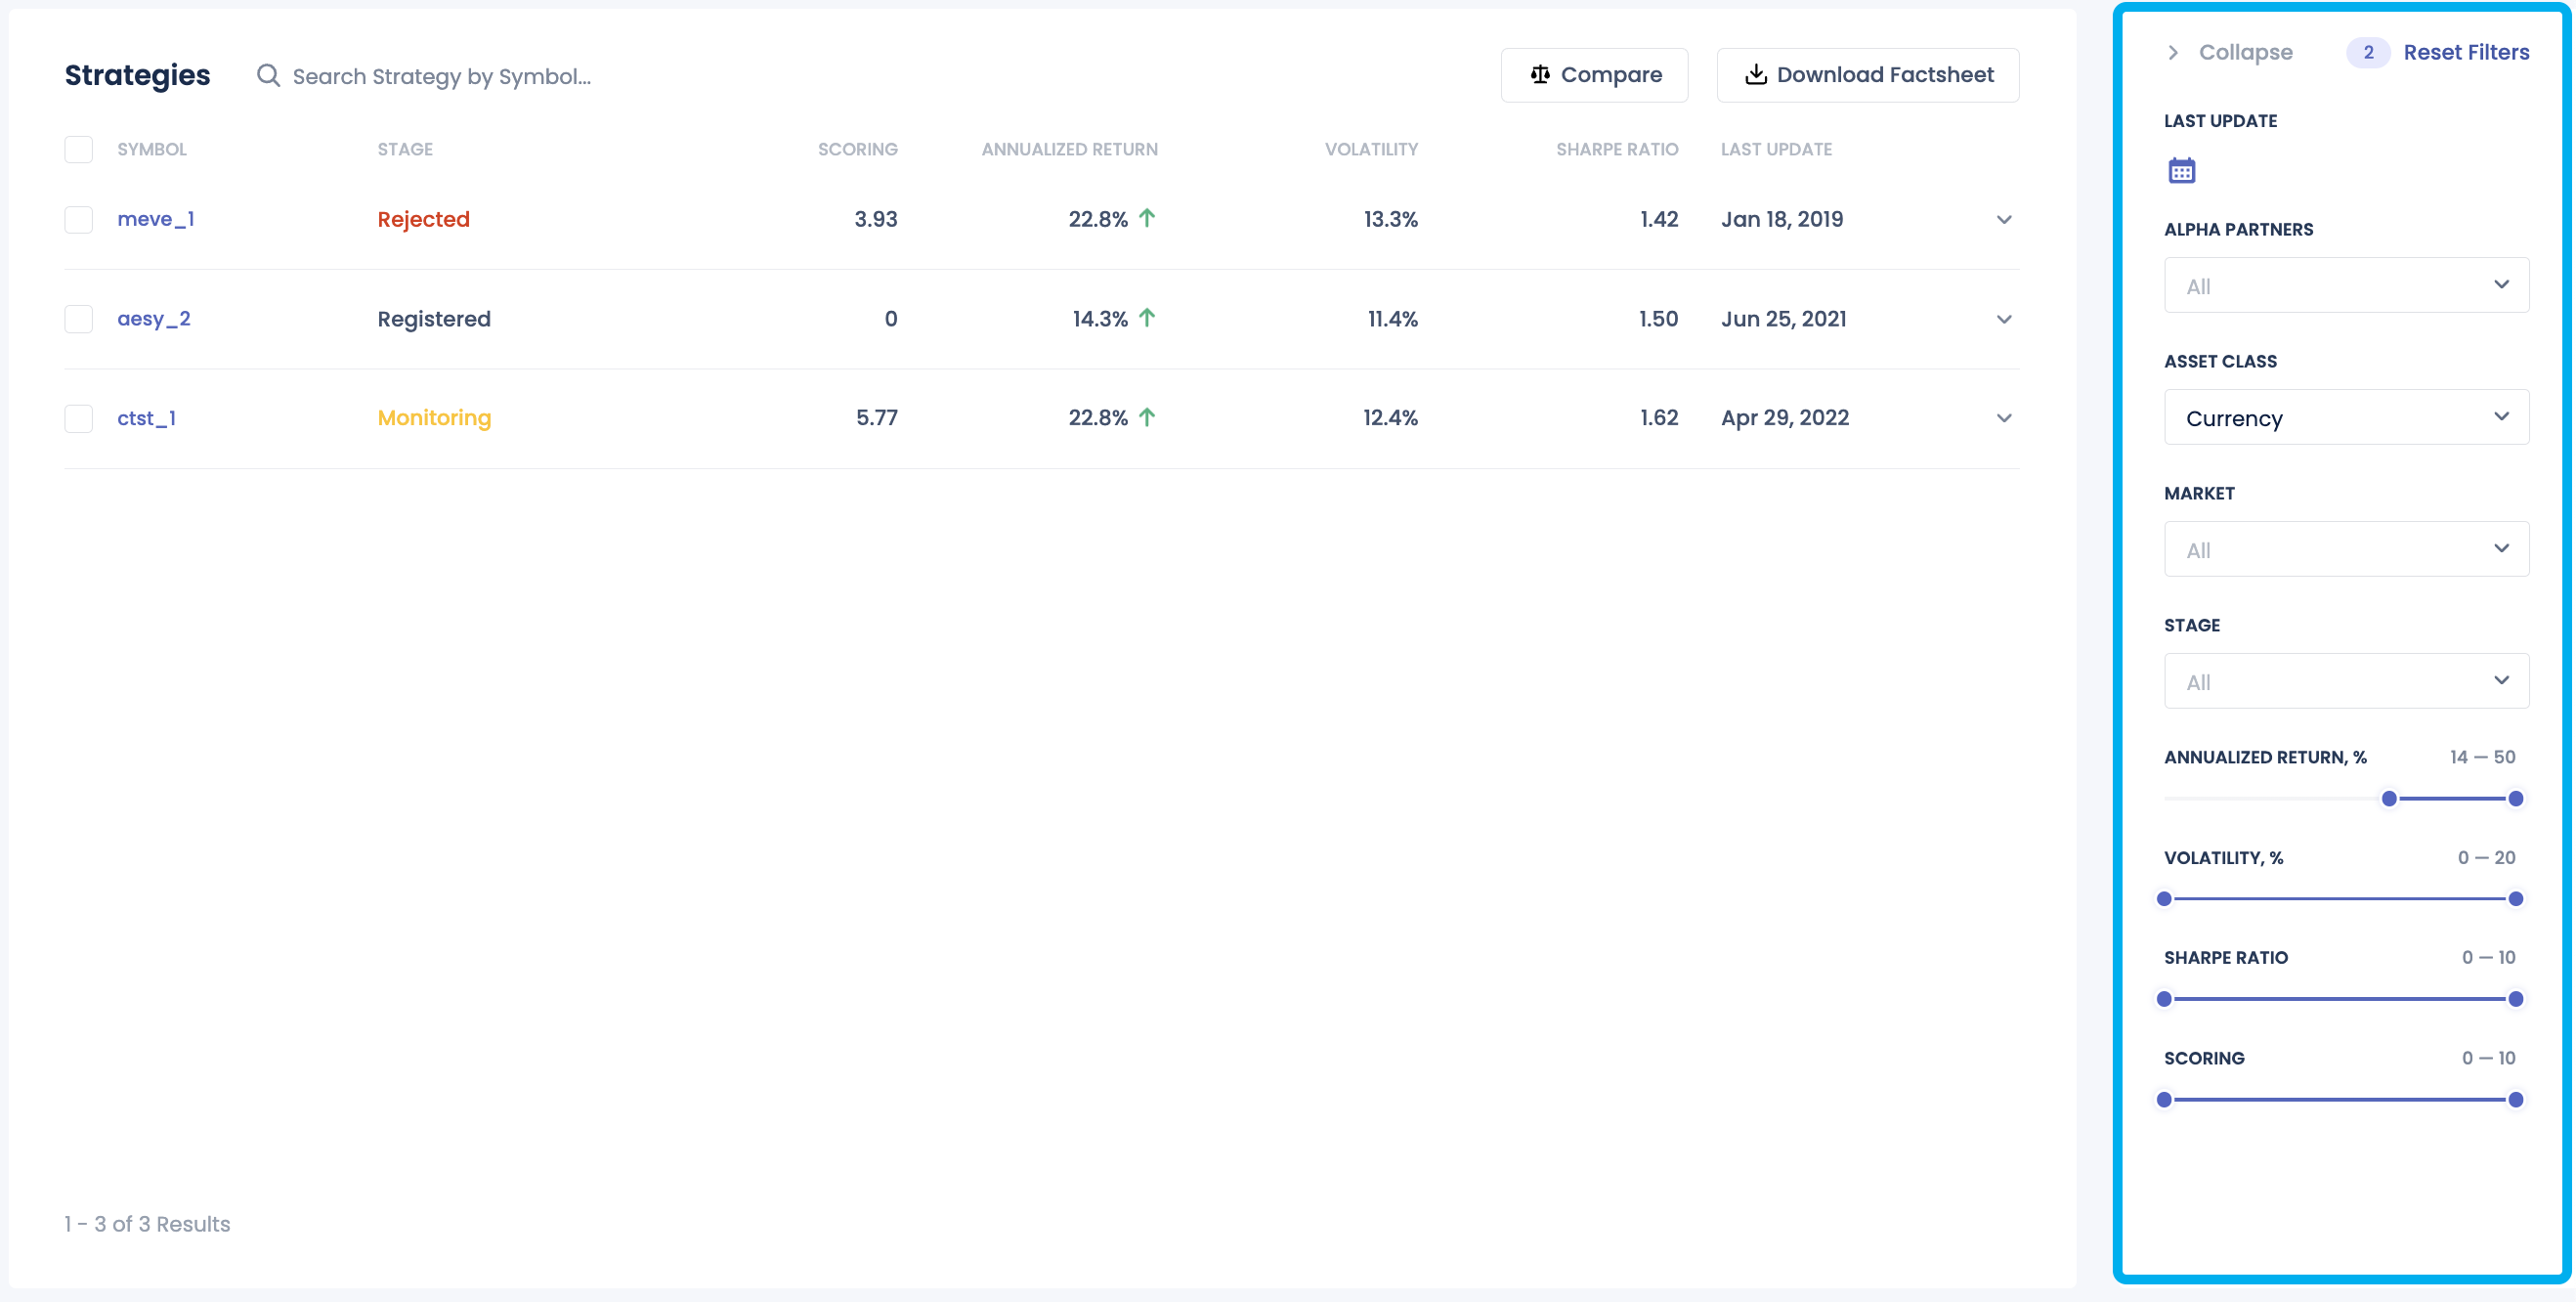
Search Strategies
The search functionality in the Strategies section allows managers to filter and search for strategies based on specific criteria. This feature streamlines the process of finding strategies that align with the manager's investment goals and preferences.
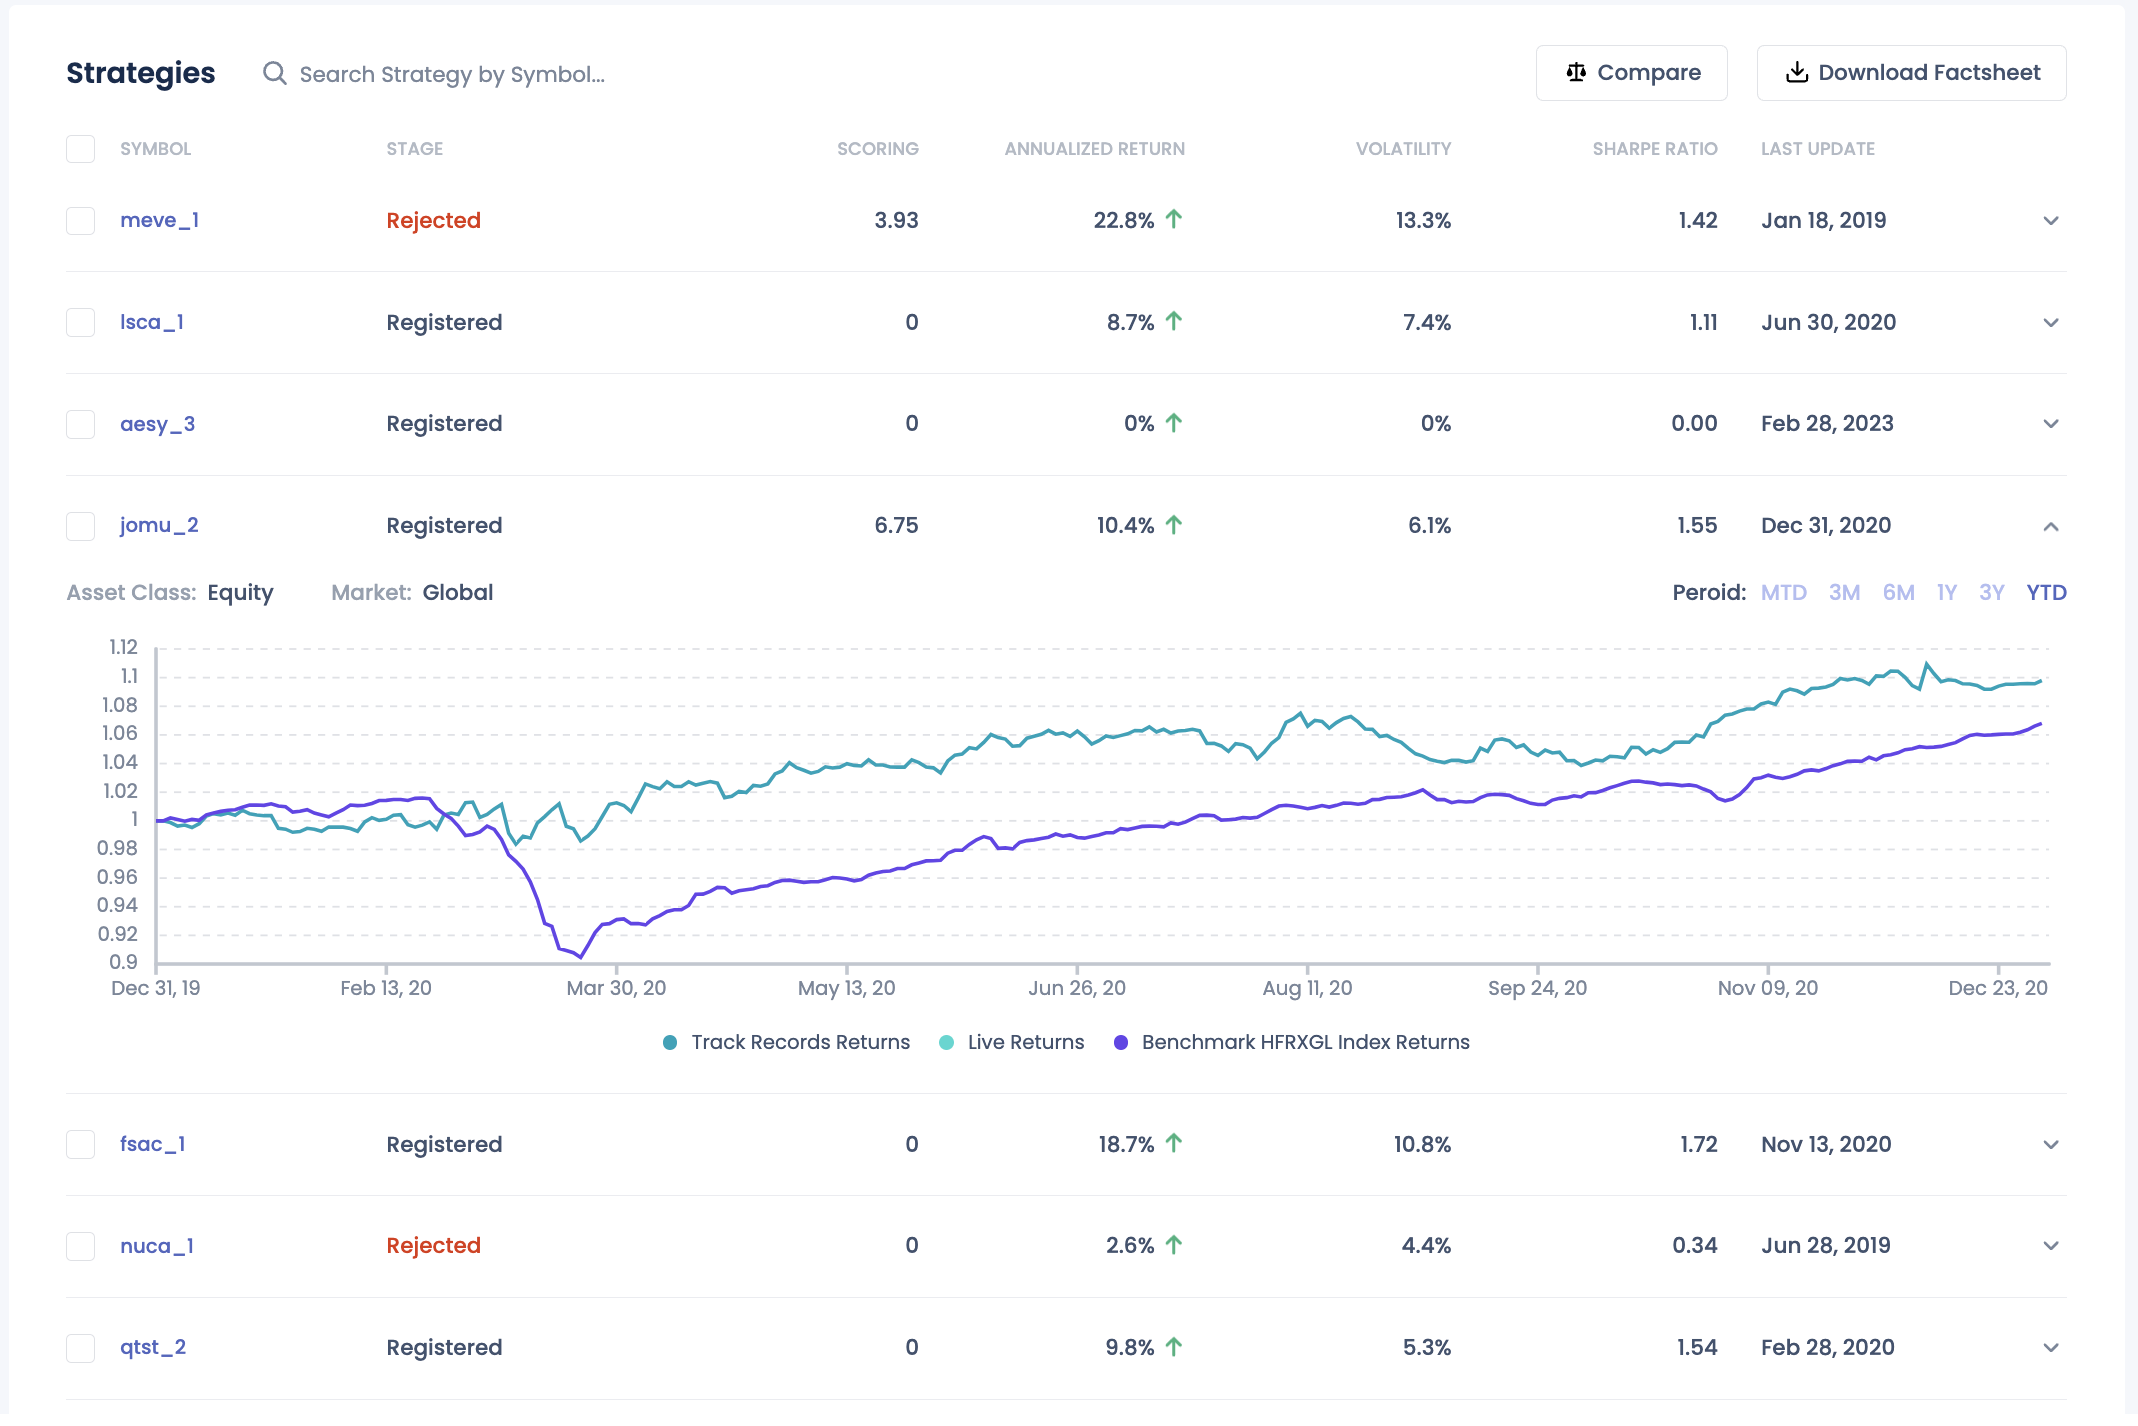
Performance Preview
The Performance Preview section provides a quick snapshot of each strategy's performance metrics, enabling managers to assess strategies at a glance. Key metrics such as returns, volatility, and drawdown are displayed to give an overview of the strategy's historical performance.
Full Strategy Profile
The Full Strategy Profile offers detailed information on each strategy, including performance metrics, AUM, asset class, market coverage, and historical performance. For strategies that are live trading, this page also provides a view of positions and capital allocated. This comprehensive profile provides a deeper understanding of the strategy's characteristics and past performance.

Performance Chart
The performance chart merges live and track-record cumulative returns for the strategy. It features a date range selector that enables users to either pick a predefined period or specify a custom date range. The usage of the period button can be found here.
Positions tab
The Positions feature allows users to confirm the correctness of their strategy's open positions on an EOD basis.
This feature provides detailed information on each position, including the asset name, quantity held, current market value, and performance metrics such as percentage change and unrealized gains or losses. The content on the "Positions" tab will indicate the product in which the strategy is included.
The detailed information available for each position includes:
-
BB Yellow Key: The Bloomberg Yellow Key identifier for the asset.
-
Description: A brief description of the asset.
-
Price ($): The current market price of the asset in dollars.
-
Average Cost ($): The average purchase cost of the asset in dollars.
-
Notional Quantity: The total quantity of the asset held.
-
P&L ($): The profit or loss of the position in dollars.
-
Daily P&L ($): The daily profit or loss of the position in dollars.
-
Trading Unrealized ($): The unrealized profit or loss from trading the asset in dollars.
-
Asset Class: The category or class of the asset (e.g., equity, bond, commodity).
-
Country/Region: The country or region associated with the asset.
Additionally, users have the ability to change the date to browse positions on different dates. They can filter and sort positions by various criteria, such as asset type or performance, to prioritize the information most relevant to them. ~~For further analysis or reporting, users have the option to export position data to CSV or Excel format.~~
Capital tab
The Capital tab provides a historical view of the strategy's allocated capital over time.

Return Attribution
-
Model Basis: The return attribution utilizes the Fama French factor model (basic 3 factor model + momentum), with the factor components combined into a single representation for simplicity.
-
Data Source: The calculation is based on the last 12-month track-record returns.
-
Data Requirements: The strategy must have at least 3-month track-record returns to be eligible for calculation.
Performance and Risk Metrics
-
Data Source: The calculation is based on the track-record returns.
-
Period Definition: The periods in the table are defined in the same way as in the period picker.
Side-by-Side Comparison
The Side-by-Side Comparison feature allows managers to compare multiple strategies directly, facilitating a detailed analysis of each strategy's performance metrics, asset classes, AUM, and other key factors. This tool enables managers to evaluate and contrast different strategies efficiently.

Download Factsheet
To be added